Asia/Karachi
BlogNovember 14, 2026

What Is INP? Interaction to Next Paint and How to Fix It

What the Core Web Vitals responsiveness metric measures, and a workflow for slow interactions
Fawaz Israr
What Is INP? Interaction to Next Paint and How to Fix It
INP, short for Interaction to Next Paint, is the Core Web Vitals metric for responsiveness. It measures how long a page takes to show a visual response after a click, tap or key press, across the whole visit, and it reports roughly the slowest one. A good INP is 200 milliseconds or less, and anything above 500 milliseconds is poor, judged at the 75th percentile of real page loads. To fix a bad score, find the slow interaction in field data, see which of its three phases is long, and then reduce the JavaScript that blocks the main thread at that moment. I am a final-year Computer Science student and I build Next.js sites. I have no before-and-after INP table from a client project to show you, so everything below is general guidance from the official web.dev and React documentation. LCP and CLS only appear in passing here, because my post on Core Web Vitals explained covers all three metrics at a gentler pace. The web.dev INP guide defines it as a measure of how quickly a page responds visually to user input over the whole visit. It watches clicks, taps and key presses. Hovering, scrolling and zooming are not counted, although a gesture that includes a tap or key press is. Every interaction gets a latency, from the moment of input until the browser paints the next frame. The page then reports one value. Usually that is the worst interaction. If a page has a lot of interactions, web.dev says one of the highest is ignored for every 50 interactions, so a single freak delay on a long visit does not decide the score. The thresholds are:
  • 200 ms or less is good.
  • Above 200 ms and up to 500 ms needs improvement.
  • Above 500 ms is poor.
A page is judged on the 75th percentile of page loads, separately for mobile and desktop. INP replaced First Input Delay as a Core Web Vital on 12 March 2024, according to web.dev. FID only measured the delay before the first interaction started running, so a page could pass it while every later click felt sluggish. INP looks at all the interactions and at the whole delay, including running your code and painting the result. Every interaction splits into input delay, processing time and presentation delay. Knowing which one is large tells you where to look. Input delay is the wait before your event handlers can start. It is long when the main thread is already busy, for example while a big script is still being parsed and run during load, or while an earlier interaction is still working. Processing time is how long your handlers take to finish. A click handler that filters ten thousand rows, parses a large JSON file or triggers a heavy state update lives here. Presentation delay is the gap between the handlers finishing and the next frame appearing. The browser has to recalculate styles, do layout and paint. A huge DOM, expensive CSS or a pile of new elements added at once makes this phase long.
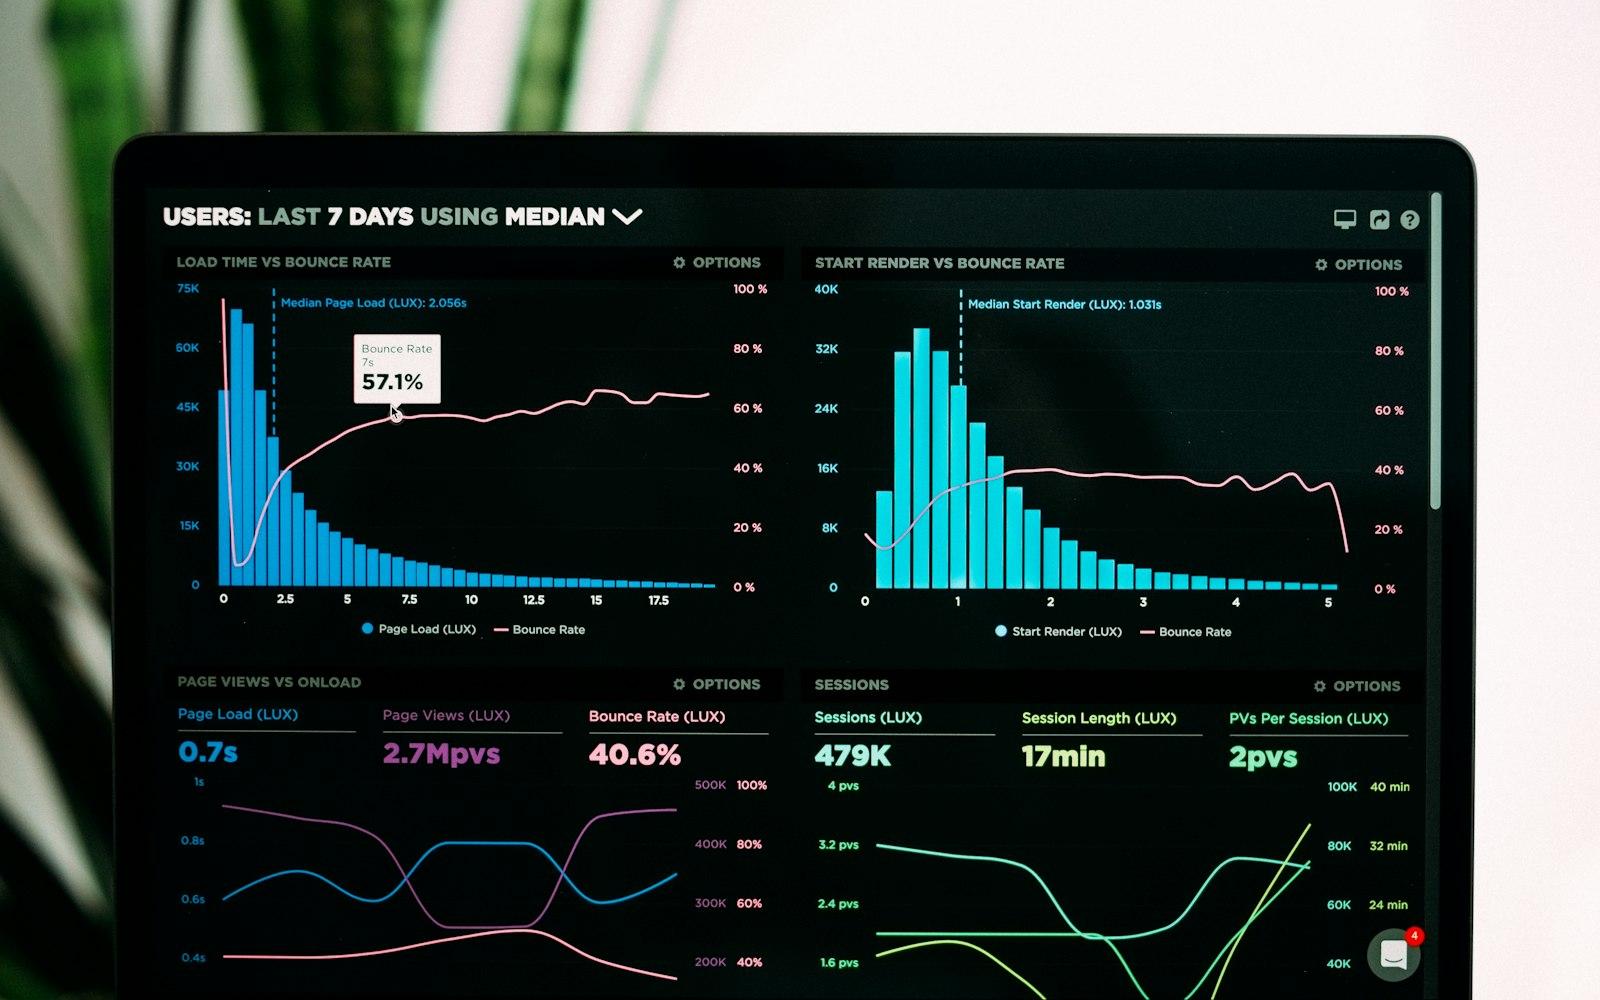
A dark laptop screen showing an analytics dashboard with bar charts and line charts for page load time, bounce rate and sessions
Start with field data, because INP only makes sense as something real people experience. The usual sources are:
  • PageSpeed Insights, which shows Chrome User Experience Report (CrUX) data for your URL or origin at the top when there is enough traffic.
  • The Core Web Vitals report in Search Console, which groups your URLs by status so you can see which templates fail.
  • A real user monitoring tool, or your own collection with the web-vitals library, covered below.
A small site often has too little traffic for CrUX to publish anything. That is normal, and it is a reason to collect your own numbers. Lab tools are weaker here. A default Lighthouse page-load run does not report INP, because nothing clicks anything. web.dev describes Total Blocking Time (TBT) as a reasonable lab proxy, but "not a substitute for INP in and of itself". Use it to spot heavy scripts, and use field data to know whether visitors are affected. I would follow this order, which matches the workflow in web.dev's guide to optimizing INP. First, collect INP with attribution from real visits. Google's web-vitals library (version 5 at the time of writing) has an attribution build that reports the element involved and the time spent in each of the three phases.
Ts
// components/INPReporter.tsx
"use client";

import { useEffect } from "react";
import { onINP } from "web-vitals/attribution";

export function INPReporter() {
  useEffect(() => {
    onINP((metric) => {
      const a = metric.attribution;
      const body = JSON.stringify({
        value: metric.value,
        rating: metric.rating,
        target: a.interactionTarget,
        type: a.interactionType,
        inputDelay: a.inputDelay,
        processingDuration: a.processingDuration,
        presentationDelay: a.presentationDelay,
        page: location.pathname,
      });
      navigator.sendBeacon("/api/vitals", body);
    });
  }, []);

  return null;
}
Render it once in the root layout and write a small /api/vitals route that stores the payload. The interactionTarget is a selector for the element, so it points at the button or input behind the slow number. The attribution can also include Long Animation Frame entries, which show the scripts that ran during the interaction. Second, reproduce it yourself. Open Chrome DevTools, go to the Performance panel, record while you perform the slow click or key press, and look at the Interactions track. The DevTools reference says hovering over an interaction shows a tooltip with its input delay, processing time and presentation delay. Throttle the CPU, or use a real mid-range phone, since a fast development machine hides most of these problems. web.dev also suggests interacting during page load, when the main thread is busiest. Third, fix the biggest phase of the worst interaction, measure again and repeat. web.dev points out that fixing one slow interaction often reveals the next one. Any task that runs longer than 50 milliseconds counts as a long task, and while it runs the browser cannot respond to input. The fix for long processing time or long input delay is to split the work and give the browser a chance to handle a waiting click or paint a frame in between. That is called yielding to the main thread. The pattern from web.dev on optimizing long tasks uses scheduler.yield() where it exists and falls back to setTimeout. When I checked that page, it listed support in Chrome and Edge 129 and Firefox 142, with no support in Safari. Browsers without it still yield through the fallback, though they lose the benefit of the continuation being prioritised. Check the current support table before you rely on it.
Ts
type SchedulerLike = { yield?: () => Promise<void> };

function yieldToMain(): Promise<void> {
  const scheduler = (globalThis as { scheduler?: SchedulerLike }).scheduler;
  if (scheduler?.yield) {
    return scheduler.yield();
  }
  // Fallback: the timeout callback runs in a new task.
  return new Promise((resolve) => setTimeout(resolve, 0));
}

export async function processInChunks<T>(
  items: T[],
  handle: (item: T) => void,
) {
  let lastYield = performance.now();

  for (const item of items) {
    handle(item);

    // Give the browser a turn roughly every 40 ms.
    if (performance.now() - lastYield > 40) {
      await yieldToMain();
      lastYield = performance.now();
    }
  }
}
The order inside a handler matters. Do the visible update first, such as toggling a menu or showing a spinner, and push the rest (analytics calls, saving) behind a yield. Then the next frame can paint before the slow part starts, which is what INP times. For handlers fired on every keystroke, debounce the expensive part so it runs once after the user pauses, and keep the cheap visual feedback outside the debounce. Layout thrashing is a classic cause of long processing time. If a loop writes a style and then reads a layout value such as offsetHeight on each pass, the browser must recalculate layout synchronously every time. Batch all the reads first, then do the writes. The Performance panel flags forced layout work, so you can find it without guessing. Presentation delay usually comes from the size of the page. A DOM with thousands of nodes costs more to restyle and paint after every change. Render long lists in pages or with virtualisation, avoid inserting large chunks of HTML in one go, and consider the CSS property content-visibility for sections far below the fold, as web.dev suggests. Input delay is mostly about what else is running: scripts that execute during load, constant timers and animations, or an earlier interaction still being processed. Each iframe also has its own main thread, so check which frame the slow interaction happened in. In React, a slow interaction is usually a state update that re-renders far more than it needs to. useTransition lets you mark the expensive part as non-urgent, so React keeps the urgent update (the text the person typed) responsive and can interrupt the heavy render if more input arrives.
Tsx
"use client";

import { useState, useTransition } from "react";

type Product = { id: number; name: string };

export function ProductSearch({ products }: { products: Product[] }) {
  const [text, setText] = useState("");
  const [query, setQuery] = useState("");
  const [isPending, startTransition] = useTransition();

  function onChange(e: React.ChangeEvent<HTMLInputElement>) {
    const value = e.target.value;
    setText(value); // urgent: the input must update right away
    startTransition(() => {
      setQuery(value); // non-urgent: the big list can lag behind
    });
  }

  return (
    <>
      <input value={text} onChange={onChange} placeholder="Search products" />
      {isPending && <p>Updating results...</p>}
      <ProductList products={products} query={query} />
    </>
  );
}
The React docs say a transition cannot control a text input directly, which is why there are two state variables here: one for the input and one for the query. useDeferredValue does a similar job when the value comes from props or a hook you cannot wrap. Neither one makes the work cheaper, so if the list render is slow on its own, reduce what it renders. On memoisation, I would not scatter useMemo, useCallback and memo everywhere. Add them where the Performance panel shows a re-render that is expensive and unnecessary. React Compiler 1.0 was announced as stable on 7 October 2025, and create-next-app can set up a project with it enabled. The React team's advice is to rely on the compiler in new code, use manual memoisation only where you need precise control, and leave existing memoisation alone unless you test carefully. I have not measured its effect on INP, so I treat it as a helpful default, not a cure. Next.js adds its own angle: hydration. Every Client Component ships JavaScript that must download, run and attach to the HTML before the page is fully interactive, and a click that arrives in the middle of that work waits. The practical rule is to keep Server Components as the default and put "use client" only on the small interactive pieces, such as a menu or a form, instead of at the top of a whole page. A huge client tree costs more to hydrate and to re-render. Heavy widgets not needed at first (a chart, an editor, a map) can load on demand, as the Next.js lazy loading guide describes.
Tsx
"use client";

import dynamic from "next/dynamic";
import { useState } from "react";

const SalesChart = dynamic(() => import("@/components/SalesChart"), {
  loading: () => <p>Loading chart...</p>,
});

export function ReportPanel() {
  const [open, setOpen] = useState(false);

  return (
    <>
      <button onClick={() => setOpen(true)}>Show chart</button>
      {open && <SalesChart />}
    </>
  );
}
The chart code stays out of the first bundle, so less script competes with early taps. They can, and they are often the part you did not write. Chat widgets, A/B testing tools, ad scripts and tag managers all run on the same main thread as your code, so a heavy one adds input delay to every click. A tag manager can also load further scripts that nobody on the team remembers adding. Audit what is loaded and remove anything without a clear owner. Load the rest with a late strategy, for example next/script with strategy="lazyOnload" for widgets that can wait until the browser is idle. Then confirm in the Performance panel or your attribution data that a specific script shows up in the slow interactions. Run this review before launch too, alongside the speed checks in my website launch checklist, and see technical SEO for Next.js for the rest of the setup. Here is a short checklist I would keep next to the task:
Text
1. Check field INP: PageSpeed Insights, Search Console, or your own onINP data.
2. Find the slow interaction with attribution (target, type, phase times).
3. Reproduce it in the DevTools Performance panel on a throttled CPU.
4. Identify the large phase: input delay, processing time or presentation delay.
5. Input delay: remove or defer scripts running at that moment.
6. Processing time: do the visible update first, yield, split long tasks.
7. Presentation delay: shrink the DOM, avoid big one-shot inserts.
8. React: transitions for non-urgent updates, smaller client trees.
9. Re-measure in the field after the next deploy.
Google recommends good Core Web Vitals, and its Search documentation says this, along with other page experience aspects, aligns with what its core ranking systems seek to reward. That is a reason to care, not a promise that a better INP will move a page up, and it will not rescue a page with weak content. Core Web Vitals are one set of signals among many. The better reason is simpler. A tap that answers quickly feels like a working page, and one that hangs feels broken, so people leave or tap twice. Fix it because visitors notice. I am Fawaz Israr, a full stack developer in Rahim Yar Khan, Pakistan, a final-year Computer Science student, and I work in web development at Hadi Dev Lab. If you have a Next.js or React site that feels slow to respond and you want help finding the cause, you can message me on WhatsApp or email. You can also browse my work first, or read more about me. Cover photo from Unsplash.
Share this post: